Karen's Map Catalog
Tuesday, November 22, 2011
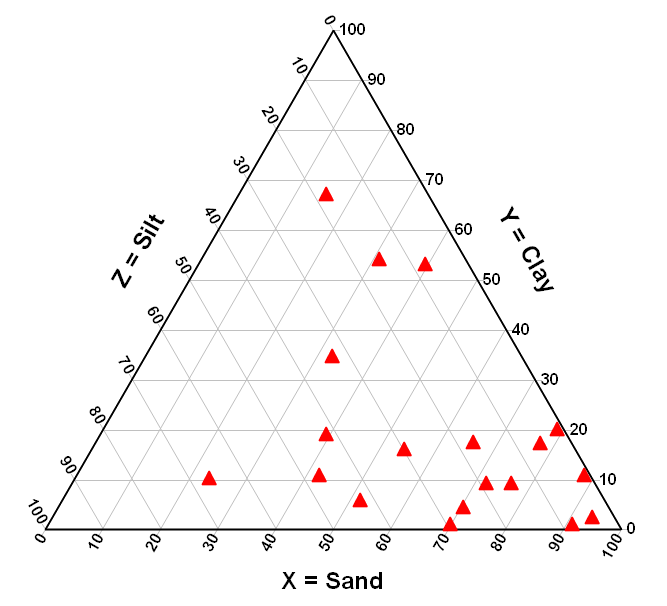
Triangular Plot
Triangular plots are used to graph data pertaining to three variable and finds an average between them. This information is percentage based and as you can see in the image above soil composition is being analyzed for sand, silt, and clay.
http://www.dplot.com/triangle_plot/triangle-plot.png
No comments:
Post a Comment
Newer Post
Older Post
Home
Subscribe to:
Post Comments (Atom)
No comments:
Post a Comment