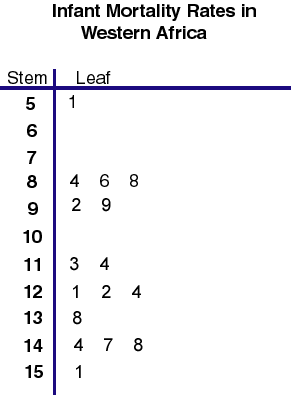
Stem and leaf plots are an easy way to analyze numerical data. On the left the stem represents the first digit of a number and on the right the leaves are the second. These plots are ideal when analyzing ages or trying to find the mean of data. This plot shows the infant mortality rate of West Africa.
http://mainland.cctt.org/mathsummer/josephbond/stemandplots/images/table2.gif
No comments:
Post a Comment