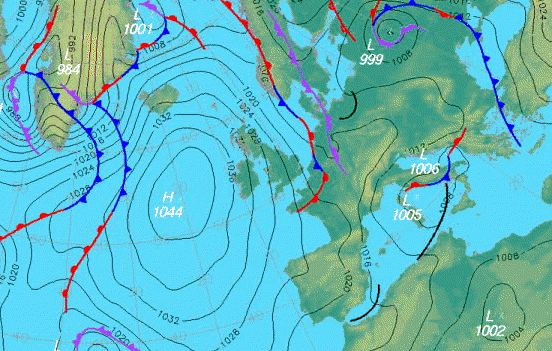
Isobar maps use lines to represent atmospheric pressure of a specific area. Lines and colors represent the information pertaining to air pressure and are used by meteorologists to convey weather information and forecasts. In this image of Europe, high and low pressure areas can be seen with these closed contour lines.
http://www.halesowenweather.co.uk/isobars.gif

No comments:
Post a Comment