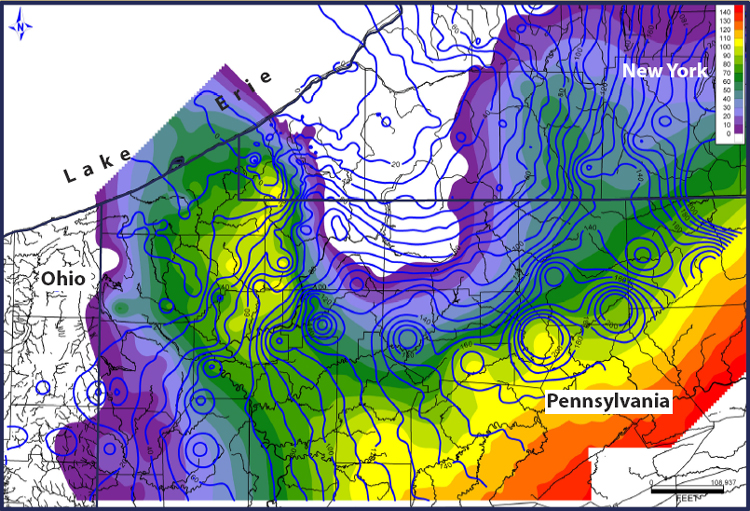
Isopach maps show the variation in thickness over an area using contour lines or colors and shading. The map above represents the thickness of limestone and implies a pattern of erosion in the area of NewYork and Pennsylvania around Lake Erie.
http://www.searchanddiscovery.com/documents/2007/07022lash/images/2_18.jpg
No comments:
Post a Comment